
Important
NSW Health is improving access to public dental services by streamlining processes, including combining the current assessment and treatment waiting lists into a single waiting list. As a result, the way the NSW public dental service data is reported will change from the December 2024 quarter. Due to these changes, the waiting list data will not be comparable to previous years. Historical data will continue to be available.
Public dental service activity
NSW Health provides access to public dental care for children under 18 years of age with a Medicare card, and adults who have or are listed as dependent on an Australian Government Health Care Card, Commonwealth Seniors Health Care Card, or Pensioner Concession Card.
Patients accessing the public dental system receive care from public dental clinics or participating private dental clinics. Patients may receive a voucher from a public dental clinic to receive specific treatment from participating private dental clinics offering treatment described by the
NSW Health Oral Health Fee for Service Scheme.
The information below describes the activity, or Dental Weighted Activity Units (DWAUs), completed by NSW Public Dental Services. During an appointment, dental practitioners provide care which is measured using item numbers. The Australian Dental Association set
The Australian Schedule of Dental Services and Glossary which contains item numbers used consistently throughout Australia. These item numbers have weightings (DWAUs), based on the complexity of the care provided.
Figure 1: NSW public dental service activity in DWAUs by quarter, June 2022 to June 2025
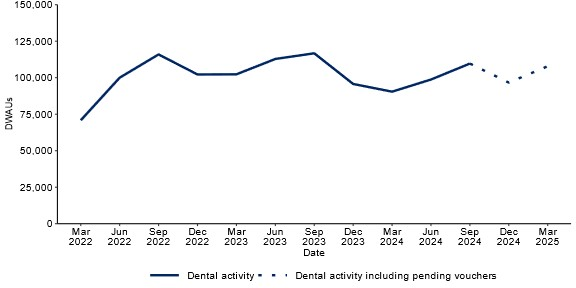
Text alternative
Source: NSW Health Local Health District and Specialty Networks.
Public dental waiting lists
NSW Health aims to see all patients within the recommended maximum waiting time for certain types of dental care. Patients are prioritised through a triage process based on how urgently they need dental care. People with more urgent dental issues receive treatment more quickly.
NSW Health has improved access to public dental services by streamlining processes, including combining the current assessment and treatment waiting lists. This means patients can be seen for urgent dental treatment while they wait for routine care. As a result of this streamlined process, the way the NSW public dental service data is reported changed on 28 October 2024. Due to these changes, the waiting list data from the December 2024 to June 2025 quarters are not comparable to previous quarters.
For more information about recommended maximum waiting times and information on how patients are prioritised to receive care in the new waiting list policy, please refer to the
Oral Health Access Policy Directive.
On 30 June 2025, 96% of people on the waitlist had been waiting less than the recommended maximum waiting time, an improvement from 68% on 30 June 2022.
Figure 2: Percentage of patients who had been waiting less than the recommended maximum waiting time for NSW public dental services, June 2022 to June 2025
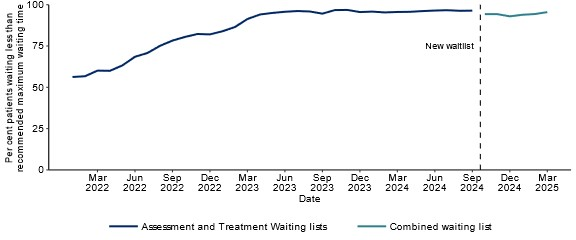
Text alternative
Source: NSW Health Local Health District and Specialty Networks
Waiting lists by local health district (LHD)
As of 30 June 2025, the proportion of people waiting for dental care for less than the recommended maximum waiting time ranged from 69% in Justice Health to 100% in Western Sydney, Nepean Blue Mountains, South Western Sydney, Central Coast, Illawarra Shoalhaven, Northern NSW and Southern NSW LHDs.
Table 1: NSW public dental service waiting list by Local Health District, as of 30 June 2025
| Sydney | 99% |
| Western Sydney | 100% |
| Nepean Blue Mountains | 100% |
| Northern Sydney | 99% |
| South Eastern Sydney | 94% |
| South Western Sydney | 100% |
| Central Coast | 100% |
| Illawarra Shoalhaven | 100% |
| Hunter New England | 93% |
| Mid North Coast | 89% |
| Northern NSW | 100% |
| Western NSW | 98% |
| Murrumbidgee | 96% |
| Southern NSW | 100% |
| Far West | 84% |
| Justice Health | 69% |
Source: NSW Health Local Health Districts and Specialty Networks
Notes: Figures represent the local health district where service was provided. Patients waiting for specialist dental services are not included.